
Custom Pine Script Indicators on TradesViz Charts
Source
Original TradesViz blog post: https://www.tradesviz.com/blog/custom-tradingview-indicators/
Guide
Introducing Custom Pine Script Indicators on TradesViz Charts Beta
We're excited to announce a new beta feature that allows you to add your own custom TradingView Pine Script indicators directly to TradesViz charts! This feature enables traders to bring their favorite custom indicators from TradingView and use them alongside their trade analysis.
Since we first introduced interactive TradingView charts in 2021, we've continuously added features and enhancements to improve how traders use charts for journaling. Based on user feedback, we integrated TradingView charts into the unified trade view tab, allowing you to review dozens of trades on a single page. To this day, no other journal offers as deep an integration with TradingView as TradesViz. We then introduced the popular chart trades view - a single chart displaying all your trades across an extended date range. The next major feature request came from active TradingView users who wanted to use their own chart templates. The closest solution was our chart templates feature (introduced in 2023), which lets you save and reuse TradingView's built-in indicators as a template.
Now we're taking it a step further. While we still can't support 100% of the indicators available on TradingView's main website, you can now create simpler versions of them using Pine Script - right here within TradesViz and use them across all TradingView charts in your dashboard.
What is This Feature?
TradesViz now includes a built-in Pine Script transpiler that converts TradingView Pine Script code into JavaScript that can run natively in our charting library. This means you can copy Pine Script code from TradingView and add it as a custom indicator on your TradesViz charts.
How It Works
- Visit your account settings: www.tradesviz.com/accounts/settings/
- Click on "Manage Indicators" under the Chart settings section

- Click "Create New"
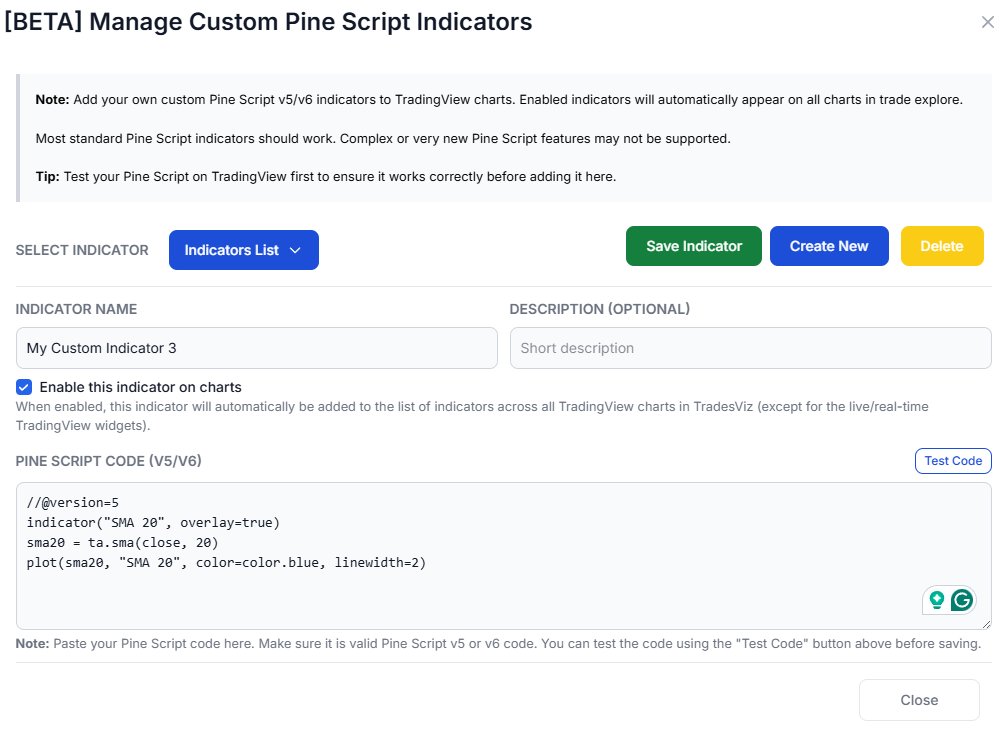
- Paste your Pine Script code
- Enter the indicator name and optionally the description
- Click on "Test Code"
- If you see a green checkmark at the bottom of the code, save the code by clicking on "Save Indicator"
- You can now add the indicator to your charts
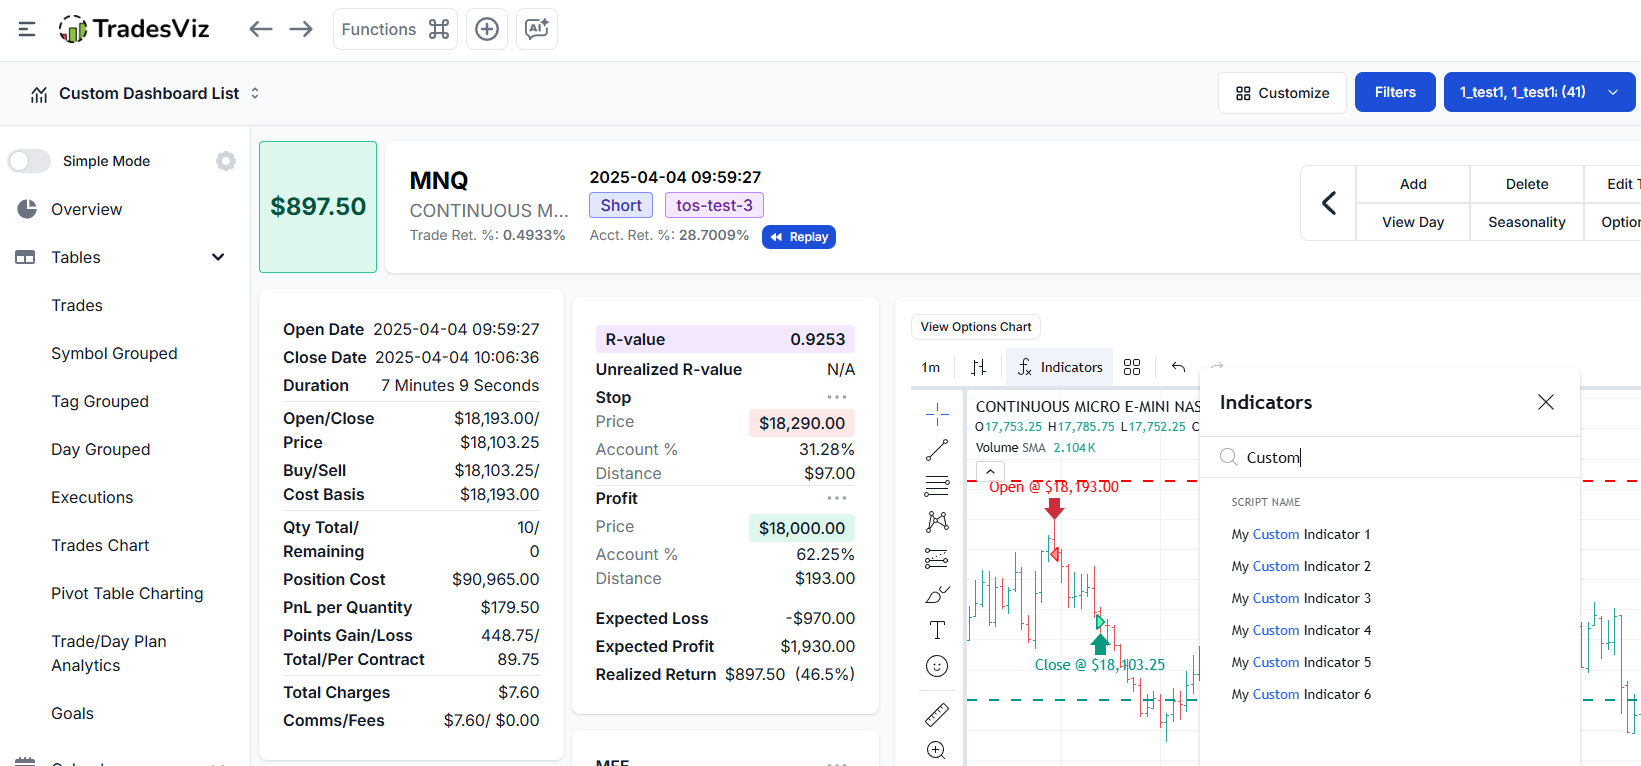
Result:
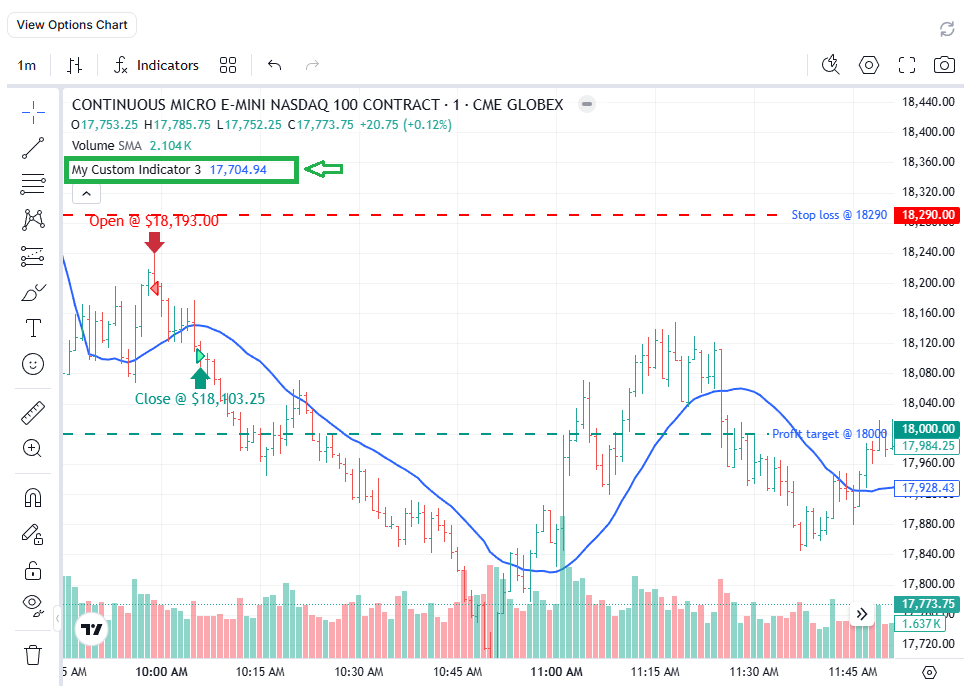
Note: If you do not see a green checkmark when you test the code [OR] if you see the green checkmark and still don't see the indicator in your tradingview chart when the custom indicator is selected, please read the rest of the blog below.
Supported Features
The transpiler supports a wide range of Pine Script functionality:
Technical Analysis
- Moving Averages: sma, ema, wma, rma, vwma, hma, alma
- Oscillators: rsi, stoch, cci, mfi, roc, mom, cmo, wpr
- Volatility: atr, tr, stdev, bb
- Trend: supertrend, dmi, adx, macd, sar
Math Functions
math.abs,math.sqrt,math.powmath.log,math.expmath.round,math.floor,math.ceilmath.max,math.min,math.avg- Trigonometric functions and more
Input Types
input.int- Integer inputsinput.float- Float inputsinput.bool- Boolean togglesinput.string- Text inputsinput.source- Price source selection
Plot Types
plot()- Line plotsplotshape()- Shape markershline()- Horizontal linesbgcolor()- Background colorsfill()- Area fills
Price Sources
open,close,high,low,volume,hl2,hlc3,ohlc4,time
Example: Working Indicators
Here are examples of indicators that work well with the transpiler:
Example 1: Simple RSI with Overbought/Oversold Levels
`//@version=6
indicator("RSI Indicator", overlay=false)`
length = input.int(14, title="RSI Length", minval=1)
overbought = input.int(70, title="Overbought Level")
oversold = input.int(30, title="Oversold Level")
rsiValue = ta.rsi(close, length)
plot(rsiValue, title="RSI", color=color.blue, linewidth=2)
hline(overbought, "Overbought", color=color.red)
hline(oversold, "Oversold", color=color.green)
hline(50, "Middle", color=color.gray)
Example 2: SuperTrend Indicator
`//@version=6
indicator("SuperTrend", overlay=true)`
atrLength = input.int(10, title="ATR Length")
factor = input.float(3.0, title="Factor")
[supertrend, direction] = ta.supertrend(factor, atrLength)
plot(direction < 0 ? supertrend : na, title="Up Trend", color=color.green, linewidth=2)
plot(direction > 0 ? supertrend : na, title="Down Trend", color=color.red, linewidth=2)
Example 3: Dual Moving Average Crossover
`//@version=6
indicator("MA Crossover", overlay=true)`
fastLength = input.int(9, title="Fast MA Length")
slowLength = input.int(21, title="Slow MA Length")
fastMA = ta.ema(close, fastLength)
slowMA = ta.ema(close, slowLength)
plot(fastMA, title="Fast MA", color=color.blue)
plot(slowMA, title="Slow MA", color=color.red)
buySignal = ta.crossover(fastMA, slowMA)
sellSignal = ta.crossunder(fastMA, slowMA)
plotshape(buySignal, title="Buy", style=shape.triangleup, location=location.belowbar, color=color.green)
plotshape(sellSignal, title="Sell", style=shape.triangledown, location=location.abovebar, color=color.red)
Example 4: Bollinger Bands
`//@version=6
indicator("Bollinger Bands", overlay=true)`
length = input.int(20, title="Length")
mult = input.float(2.0, title="Multiplier")
basis = ta.sma(close, length)
dev = mult * ta.stdev(close, length)
upper = basis + dev
lower = basis - dev
plot(basis, title="Basis", color=color.blue)
plot(upper, title="Upper", color=color.red)
plot(lower, title="Lower", color=color.green)
fill(plot(upper), plot(lower), color=color.new(color.blue, 90))
Important Limitations
Please read this section carefully before using custom indicators.
Due to the complex nature of Pine Script and the transpilation process involving third-party libraries, there are significant limitations to what can be supported.
Unsupported Features
Feature | Reason |
|---|---|
Arrays ( | Complex state management not supported |
Maps ( | Not implemented in the runtime |
Drawing Objects ( | Chart drawing API not available |
Strategy Functions ( | Only indicators supported, not strategies |
Request Functions ( | External data requests not supported |
Alert Functions ( | Alert system not integrated |
Custom Types ( | User-defined types not supported |
Persistent Variables with Arrays ( | Complex state not supported |
| Intrabar persistence not available |
Partially Supported Features
Feature | Limitation |
|---|---|
Custom Functions with Color Returns | Functions that return |
Multi-line Custom Functions | Complex function bodies with comma-separated declarations may have issues |
| Gradient colors may be replaced with default colors |
Session-based Logic | Limited timezone support |
| May not be honored exactly |
Known Issues
- Comma-separated variable declarations inside custom functions (e.g.,
r1 = 173.0, g1 = 216.0) may not parse correctly - Custom color gradient functions are automatically replaced with a default blue color
- Very complex nested calculations may produce unexpected results
- Some Pine Script v6 syntax may not be fully supported
!! Beta Feature Disclaimer !!
THIS IS A BETA FEATURE.
By using custom Pine Script indicators, you acknowledge and accept the following:
- No Guarantees: Due to the complex nature of Pine Script transpilation and the use of third-party libraries, we cannot guarantee that any indicator will work correctly, produce accurate results, or work at all.
- Use at Your Own Risk: Custom indicators are provided as-is. Trading decisions based on custom indicator outputs are entirely your responsibility.
- Accuracy Not Verified: We do not verify that transpiled indicators produce the same results as they would on TradingView. Differences in calculation methods, data precision, and timing may cause variations.
- Feature May Change: As a beta feature, functionality may change, break, or be removed without notice.
- Performance Impact: Complex indicators may impact chart loading times and browser performance.
Support is Available ONLY via Email. For questions, issues, or suggestions regarding custom Pine Script indicators, please contact us at support@tradesviz.com with as much information as you can.
What to Include in Your Email
When reporting an issue, please include:
- The complete Pine Script code you're trying to use
- The error message (if any) from the browser console
- A description of what you expected vs. what happened
- Screenshots if applicable
What We CAN Help With
- Clarifying which features are supported
- General guidance on simplifying indicators for compatibility
- Potentially improving the indicator support (bug fixes)
What We CANNOT Do
- We cannot fix your specific indicators. If an indicator uses unsupported features, we cannot rewrite it for you.
- We cannot guarantee compatibility with any specific indicator.
- We cannot provide Pine Script programming support. This is not a Pine Script tutorial service.
- We cannot reverse-engineer protected/paid indicators.
We're continuously working to improve this feature. If you have suggestions for:
- Additional Pine Script functions to support
- Bug reports with reproducible examples
- General feature improvements
Please send them to support@tradesviz.com with the subject line: "Custom TradingView Indicator Suggestion"
We prioritize suggestions that:
- Include clear, reproducible examples
- Benefit a wide range of users
- Are technically feasible to implement
Tips for Best Results
Do This
- Start simple - Test with basic indicators first before trying complex ones
- Use supported TA functions - Stick to the documented supported functions
- Avoid arrays and maps - Rewrite logic to not use array operations if possible
- Use standard colors - Use
color.red,color.green, etc., instead of custom color functions - Test incrementally - Add features one at a time to identify what breaks
Avoid This
- Don't use paid/protected indicators (they're usually obfuscated)
- Don't use indicators that heavily rely on arrays or tables
- Don't use strategy scripts (only indicators are supported)
- Don't use
request.security()for multi-timeframe analysis - Don't expect exact parity with TradingView results
Conclusion
Custom Pine Script indicators on TradesViz charts open up exciting possibilities for traders who want to use their favorite TradingView indicators alongside their trade analysis. While this beta feature has limitations, it supports a wide range of common technical analysis functions and plot types.
Remember: this is a beta feature with inherent limitations. Start with simple indicators, test thoroughly, and reach out to support@tradesviz.com if you have questions or suggestions.
Quick Reference: Supported Functions
Moving Averages
ta.sma- Simple Moving Averageta.ema- Exponential Moving Averageta.wma- Weighted Moving Averageta.rma- Relative Moving Averageta.vwma- Volume-Weighted Moving Averageta.hma- Hull Moving Averageta.alma- Arnaud Legoux Moving Averageta.swma- Symmetrically Weighted Moving Averageta.linreg- Linear Regression
Oscillators
ta.rsi- Relative Strength Indexta.stoch- Stochasticta.cci- Commodity Channel Indexta.mfi- Money Flow Indexta.roc- Rate of Changeta.mom- Momentumta.cmo- Chande Momentum Oscillatorta.wpr- Williams %Rta.tsi- True Strength Indexta.ao- Awesome Oscillator
Trend Indicators
ta.supertrend- SuperTrendta.dmi- Directional Movement Indexta.adx- Average Directional Indexta.macd- MACDta.sar- Parabolic SAR
Volatility
ta.atr- Average True Rangeta.tr- True Rangeta.stdev- Standard Deviationta.variance- Varianceta.bb- Bollinger Bandsta.kc- Keltner Channels
Price Levels
ta.highest- Highest valueta.lowest- Lowest valueta.highestbars- Bars since highestta.lowestbars- Bars since lowestta.pivothigh- Pivot Highta.pivotlow- Pivot Low
Crossovers
ta.crossover- Crosses aboveta.crossunder- Crosses belowta.cross- Any crossta.rising- Consecutively risingta.falling- Consecutively falling
Volume
ta.obv- On Balance Volumeta.vwap- VWAPta.cum- Cumulative sum
Statistical
ta.percentile_linear_interpolation- Percentileta.percentrank- Percent Rankta.correlation- Correlationta.median- Medianta.mode- Mode
Updated on: 17/07/2026
Thank you!